The graph shows the monthly sales of flowers in a store.
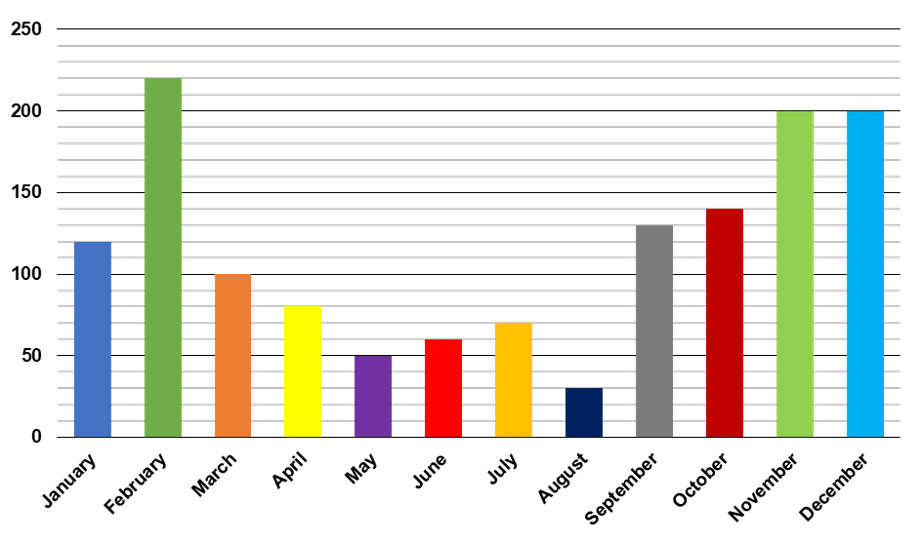
Here are three statements about the graph.
- The sales in January are triple the sales in June.
- Sales in the first quarter of the year are greater than the last quarter of the year.
- The combined sales in March, April and May are equal to the sales in July, August, and September.