The graph shows the average temperature in Australia across 12 months.
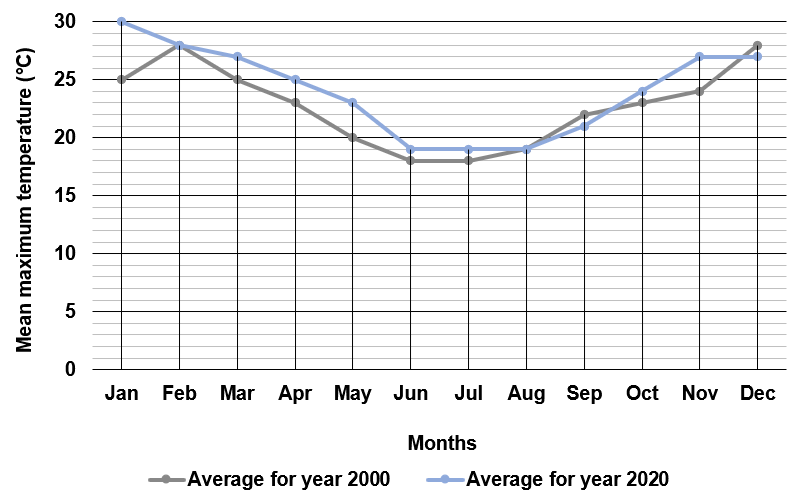
Here are three statements about the graph.
- The average temperature in January 2020 is double the average temperature in June 2000.
- Average temperature in November 2000 is 3 degrees higher than November 2020.
- The combined average temperatures in July, August and September in 2020 compared to the same months in 2000 were the same.