The bars on the graph show the normal range of blood pressure for people of various ages.
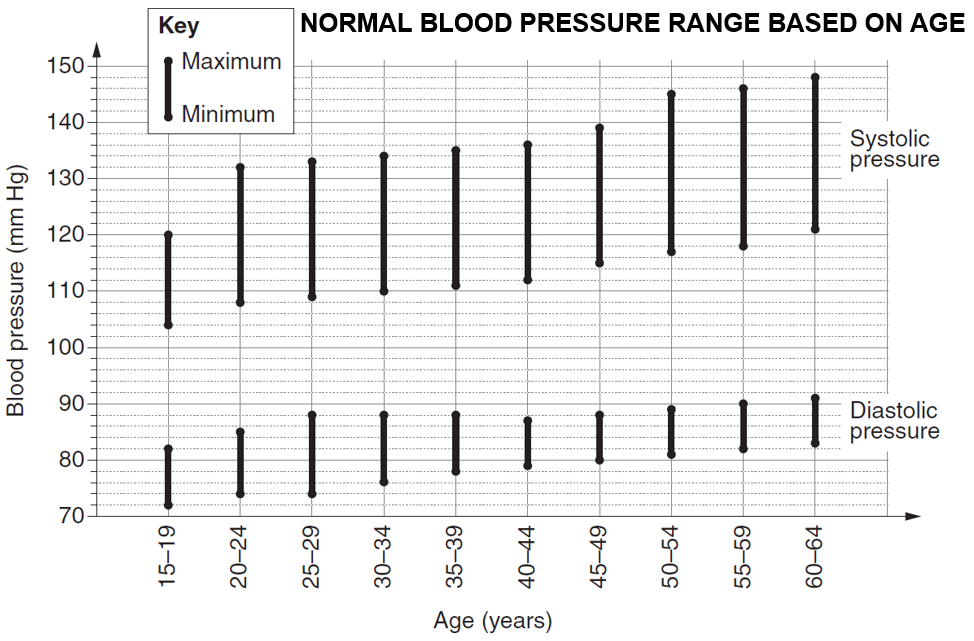
Blood pressure is measured using two numbers: systolic pressure and diastolic pressure. If the measurement shows 110 systolic and 80 diastolic, it is written as ‘110 over 80’.