The graph shows the rainfall in Lidcombe, NSW for the year of 2020:
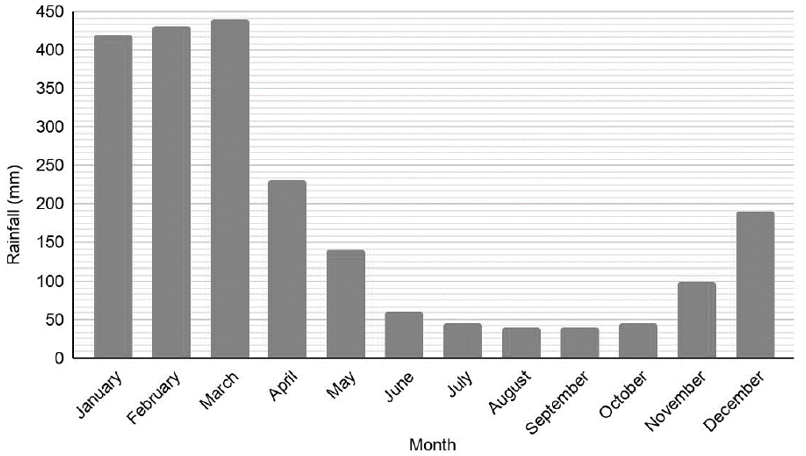
Here are three statements about the graph:
- July had twice as much rainfall as August
- December had approximately 9 cm more rainfall than November
- The rainfall in February, March and April combined was more than 1 metre.
Here are three statements about the graph: