The following graph shows the number of children attending a play centre in one year.
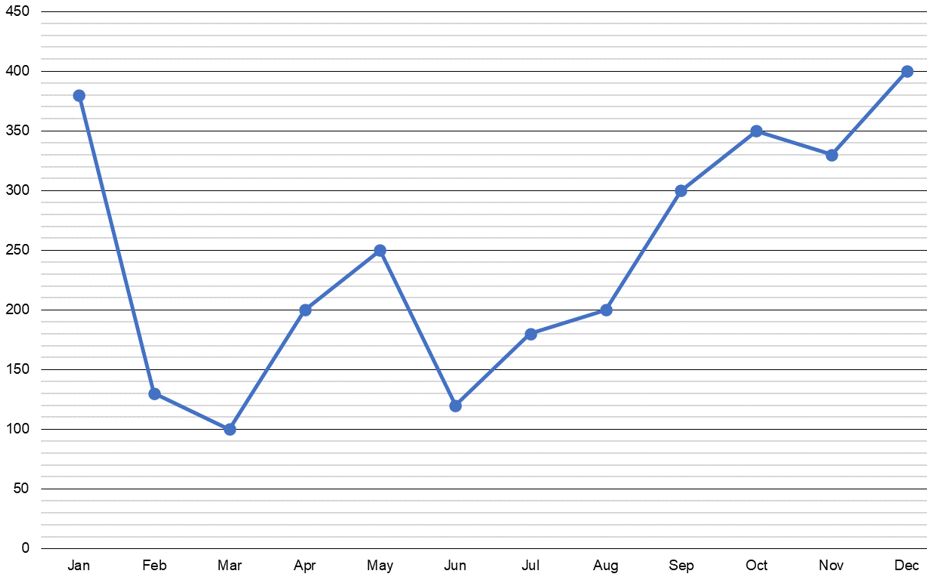
- Statement 1 - The number of children entering the play centre tripled in December compared to January.
- Statement 2 - Entrance numbers in the first quarter of the year were significantly higher than the numbers in the last quarter.
- Statement 3 - February, March and June were the months with the lowest number of attendances.