The graph shows the average monthly rainfall in Cairns for one year.
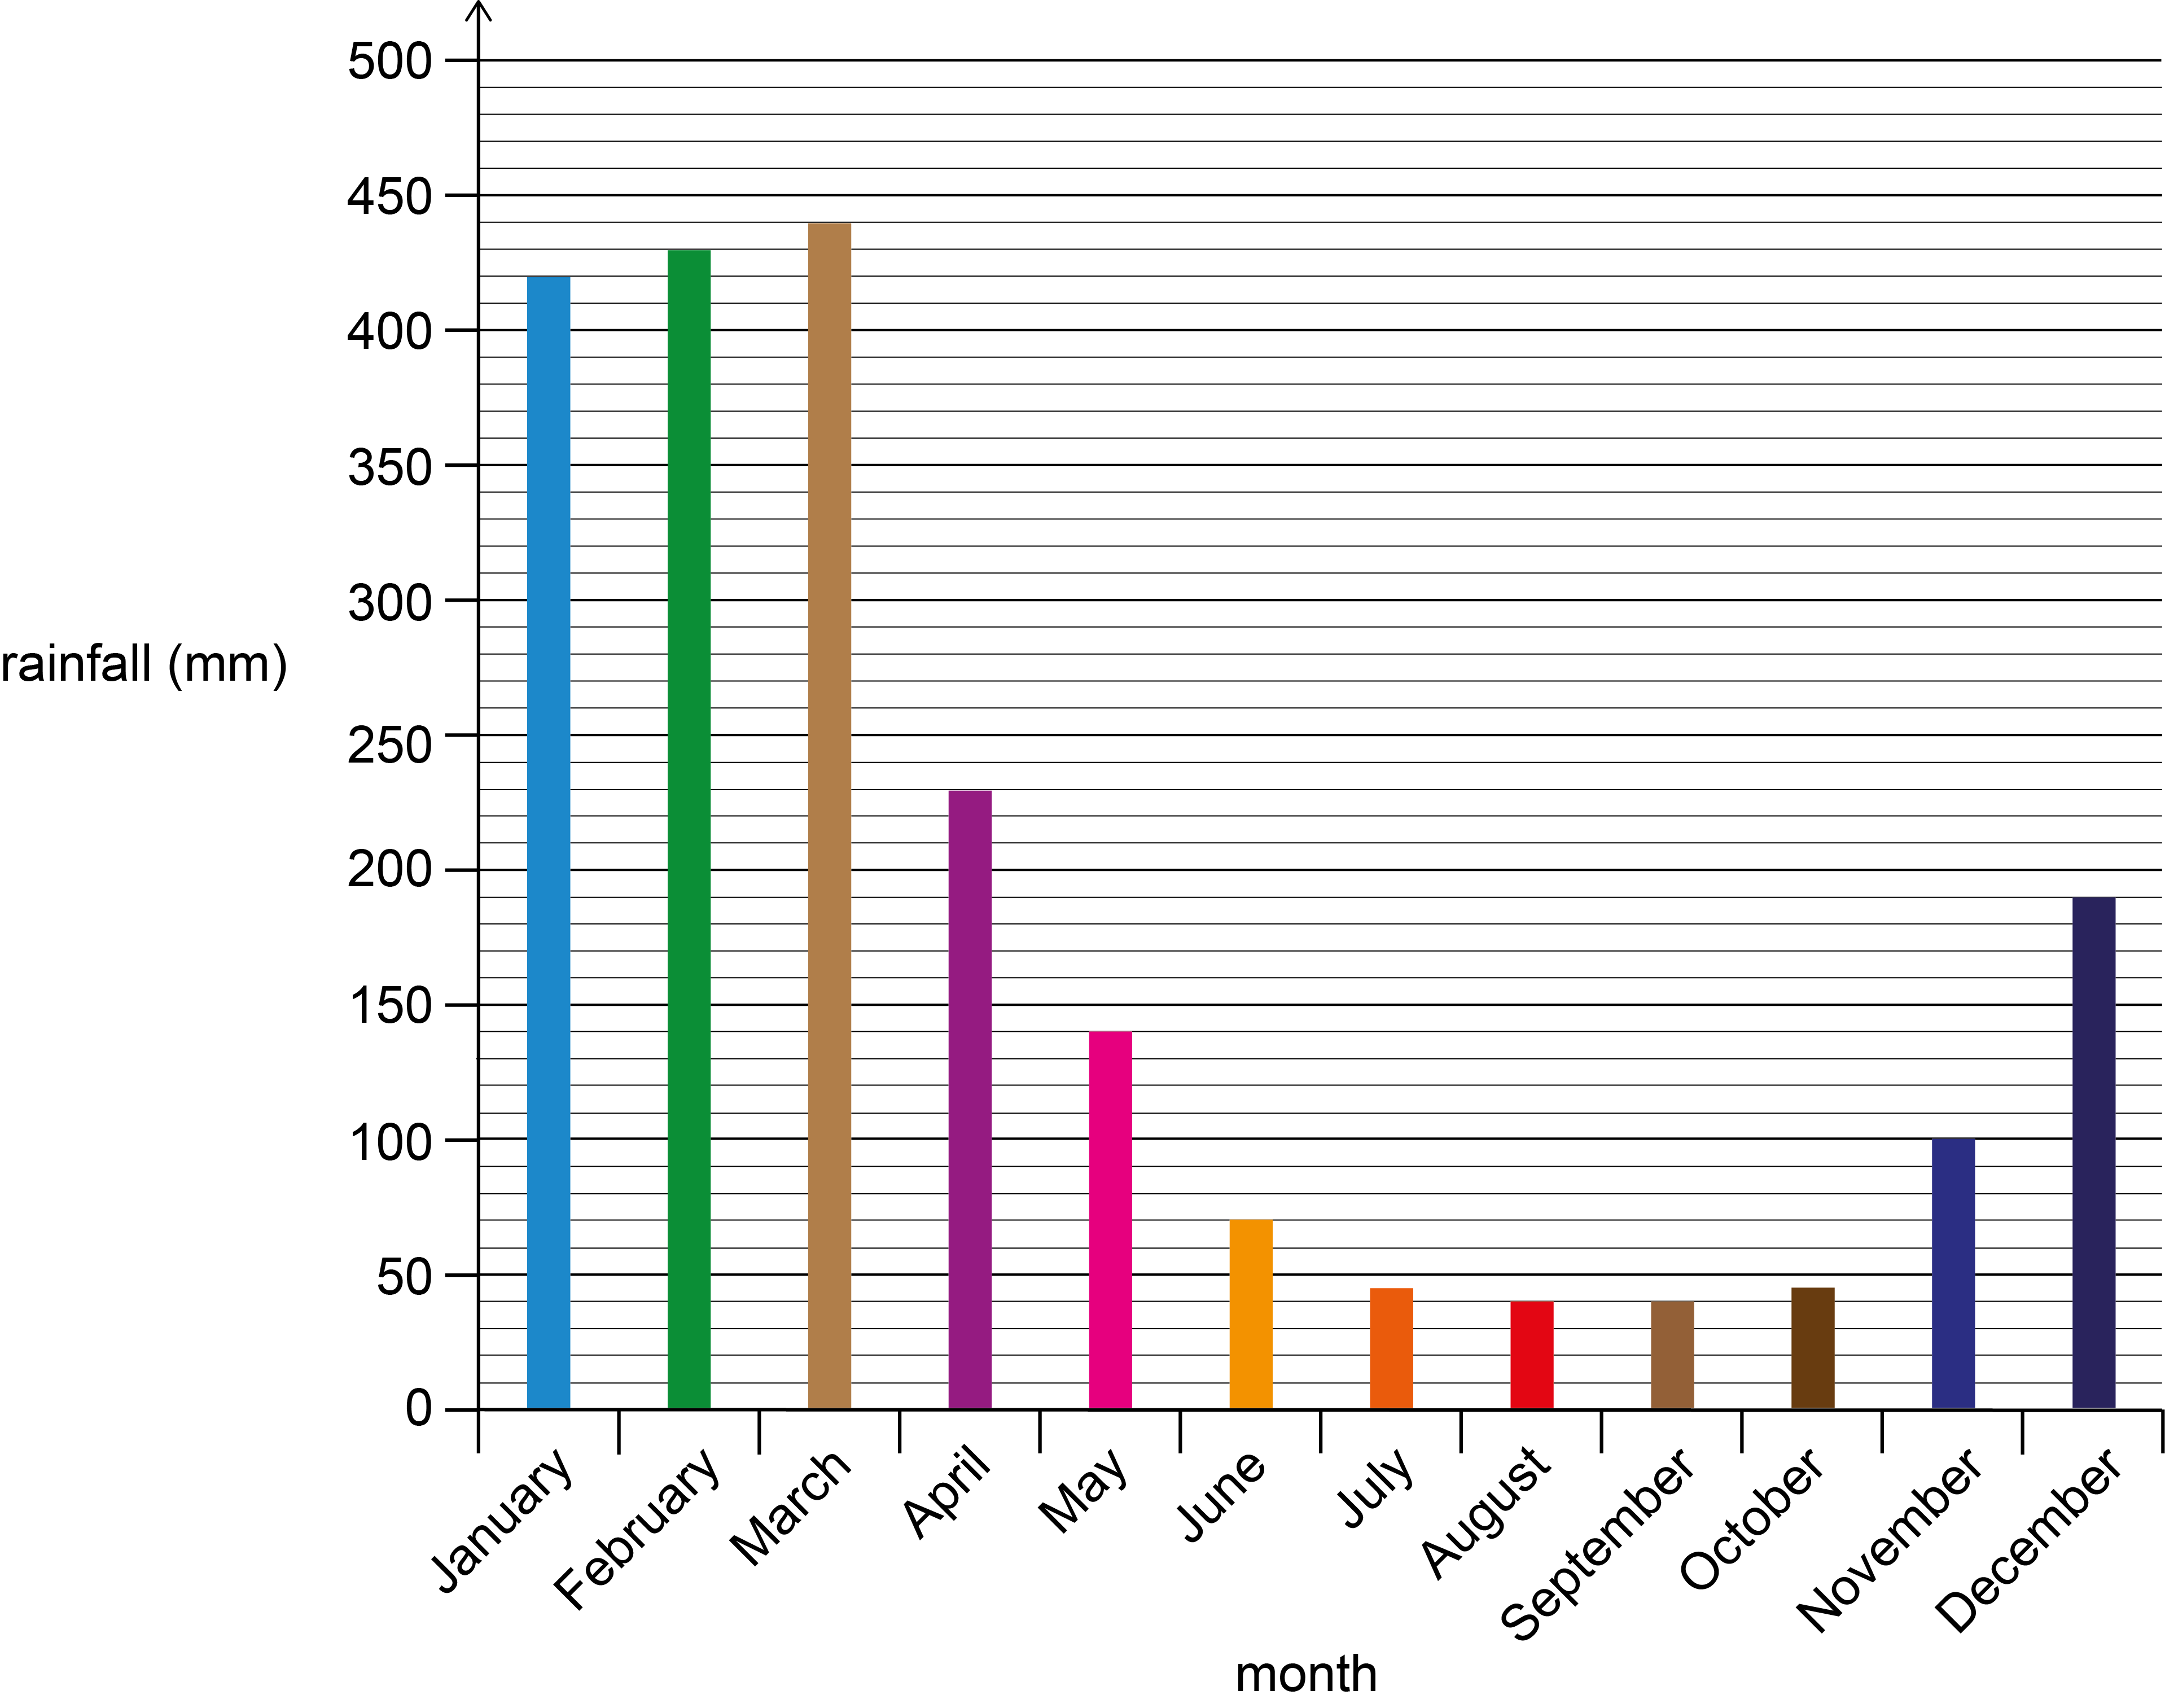
Here are three statements about the graph.
1. June had more than twice as much rainfall as August.
2. December had 9 cm more rainfall than November.
3. The rainfall in February, March and April combined was more than 1 metre.