The graph below shows the number of cars sold over five years by Company A and Company B.
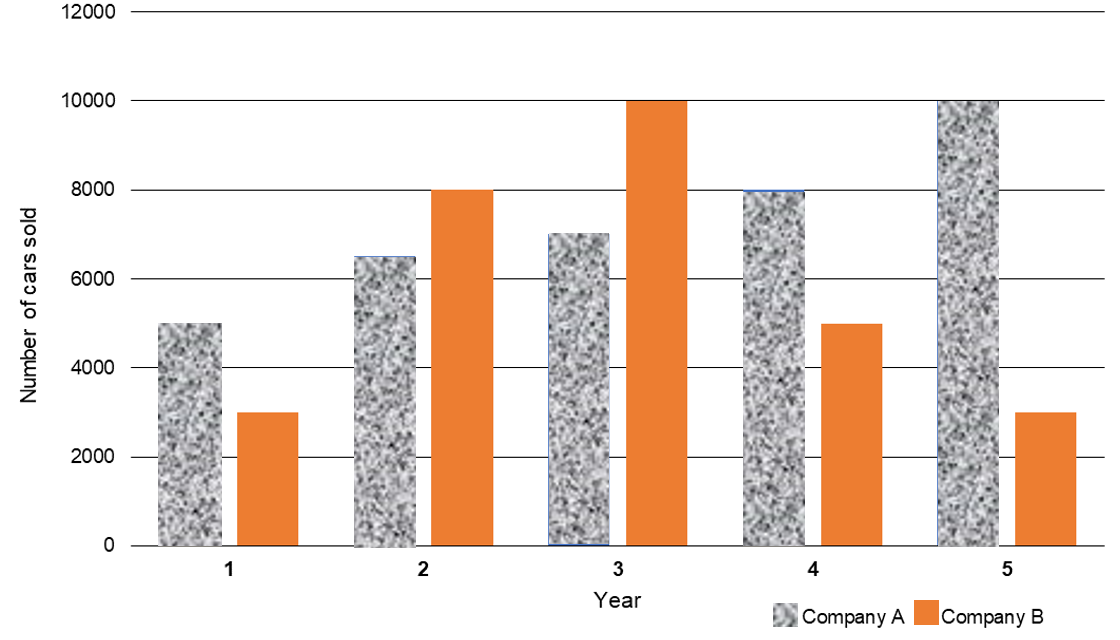
Statement 1: Company A sold more cars over the five-year period than Company B.
Statement 2: The largest decline in car sales for Company B was between years 4 and 5.
Statement 3: Company A increased their sales by 100% in year 5 compared to year 1.
Statement 4: Company B decreased their sales by 50% between year 3 and year 4.